- Caruaru/PE

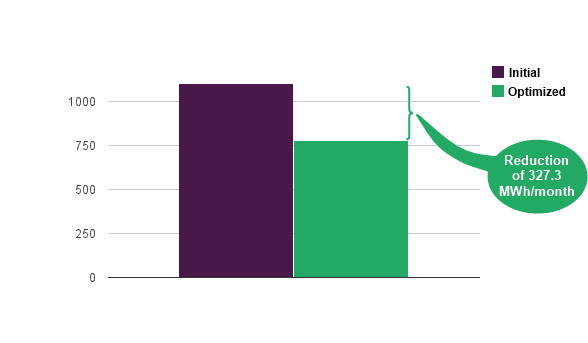
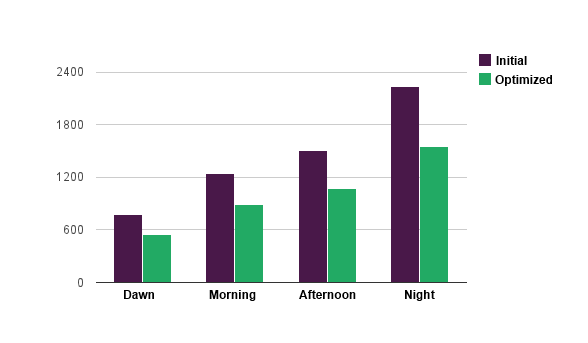
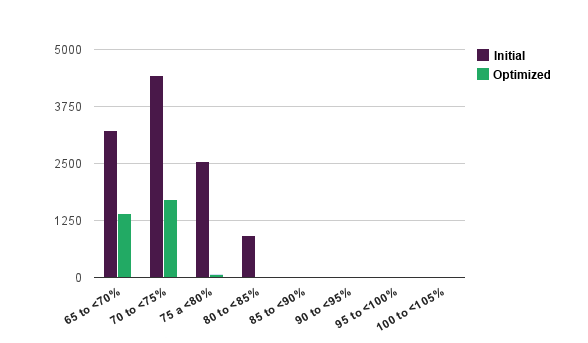
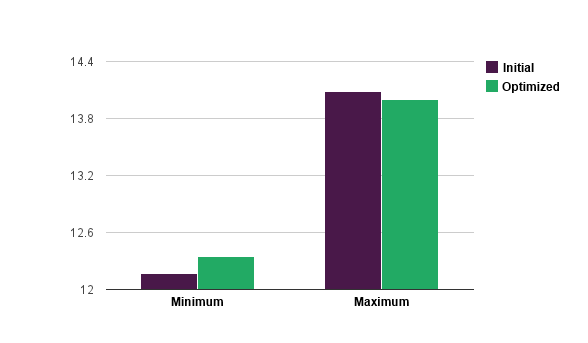
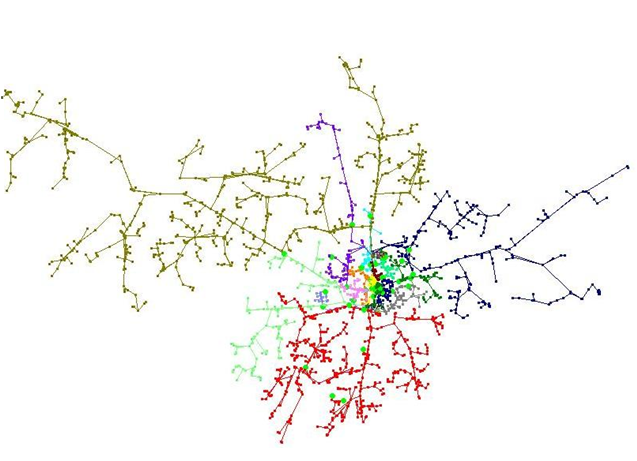
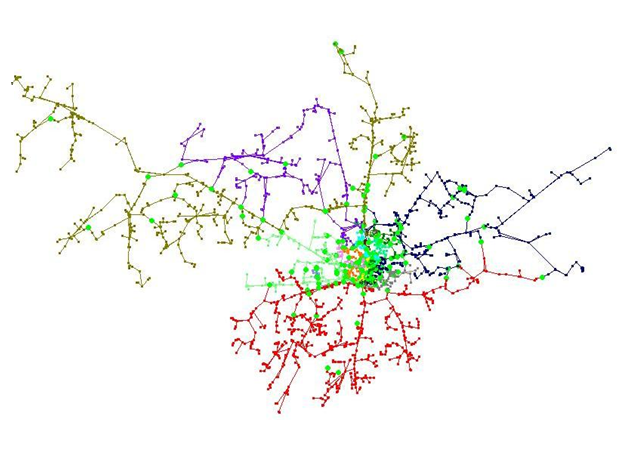
Data and results of the project to reduce technical losses.


Results Scenario 1

Technical and financial results for the first scenario of the project.

Energy Losses Reduction Demand Losses Reduction Number of Maneuvers
6,9% 7,4% 22

Results Scenario 3

Technical and financial results for the third scenario of the project.

Energy Losses Reduction Demand Losses Reduction Number of Maneuvers Cable Replacement New Cables
29,7% 30,5% 160 7,6 Km 19 Km

Economic and Financial Analysis

Performed with data provided by the distribution company.

Company Consumer Society
Initial Investment [thousands of BRL] NPV [thousands of BRL] IRR [%] NPV [thousands of BRL] NPV [thousands of BRL]
Scenario 1 3,9 462 5.252% 873 1.336
Scenario 3 969,3 1.455 69% 2.913 4.368

Technical Analysis

Distribution grid data prior and after the third optimization scenario.


Energy Losses [MWh/month]

Demand Losses by Period [KW]

Overload Length [m]

Voltage Levels [KV]

Initial Configuration

Optimized Configuration (72 new switches)