Results Scenario 1
Technical and financial results for the first scenario of the project.
Results Scenario 3
Technical and financial results for the third scenario of the project.
| 10,55% |
9,92% |
412 |
7,5 Km |
104 Km |
Economic and Financial Analysis
Performed with data provided by the distribution company.
|
|
|
| 22,2 |
1.347 |
971% |
| Scenario 3 |
2.786,1 |
4.033 |
39,4% |
|
|
|
| 22,2 |
2.068 |
1.794,4% |
2.733 |
4.080 |
| Scenario 3 |
2.786,1 |
5.041 |
49,2% |
14.370 |
14.370 |
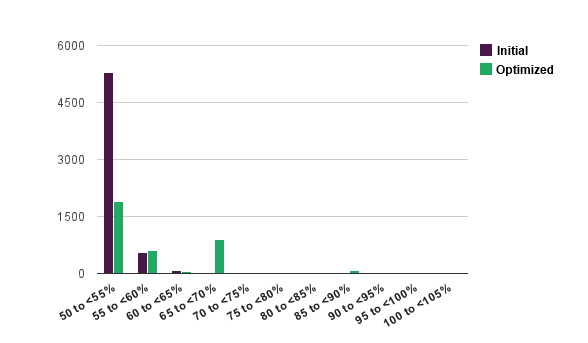
Technical Analysis
Distribution grid data prior and after the third optimization scenario.
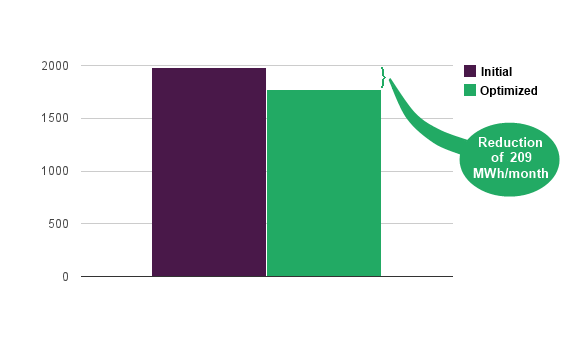
Energy Losses [MWh/month]
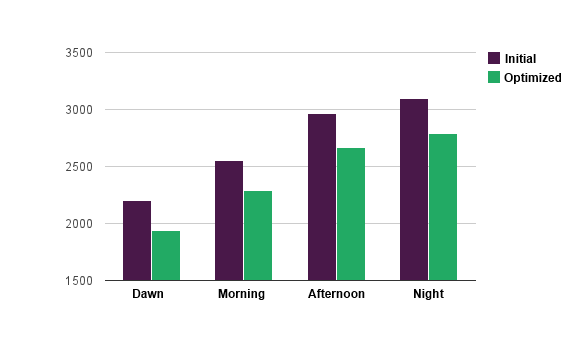
Demand Losses by Period [KW]
Overload Length [m]
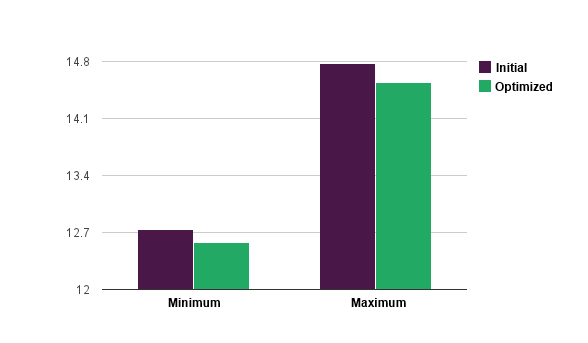
Voltage Levels [KV]
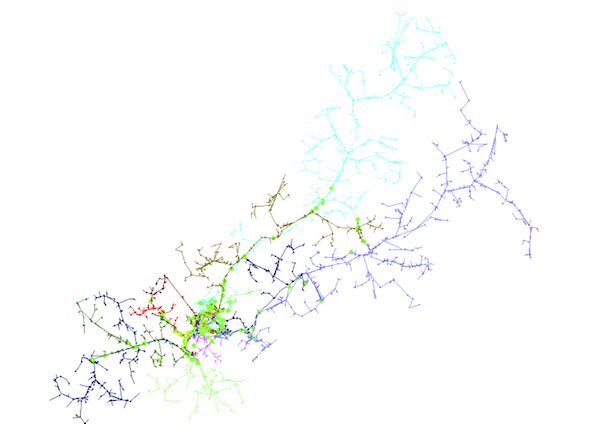
Initial Configuration
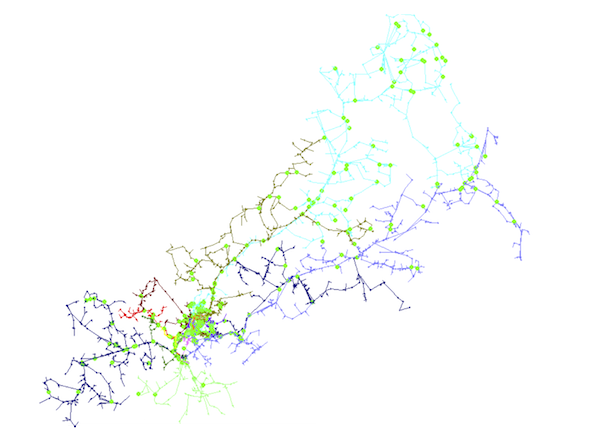
Optimized Configuration (141 new switches)
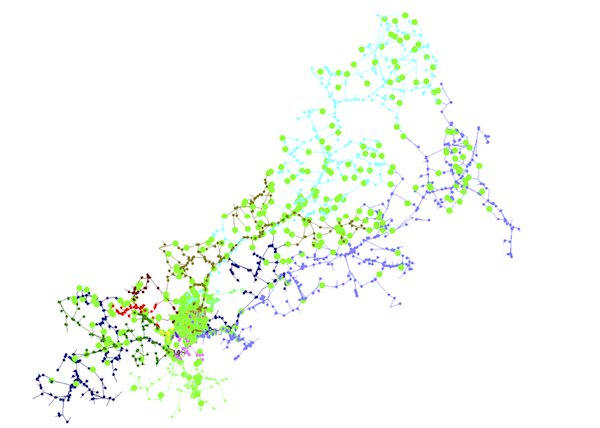
Analyzed Grid (2542 analyzed switches)
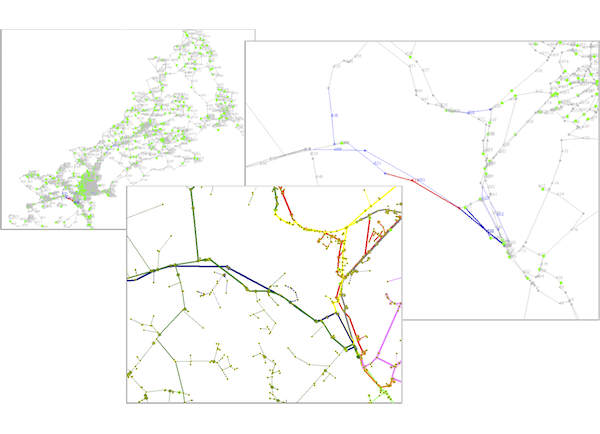
Analyzed Grid Detail
 - Sete Lagoas/MG